
-
Home
- About Us
- Products
- Application scenarios
- Download
- News


How to read a transducer datasheet
2026-09-01How to read a transducer datasheetHow to read a transducer datasheet
Teach you how to read the core information of ultrasonic transducers and quickly determine their quality
To quickly assess the quality of an ultrasonic transducer, we need to use an impedance analyzer to examine three sets of data from the transducer.
I. Measure the frequency to determine whether the transducer's frequency falls within the required range and assess the consistency of the transducer.
II. Understanding Two Figures: Impedance Curve vs. Admittance Plot
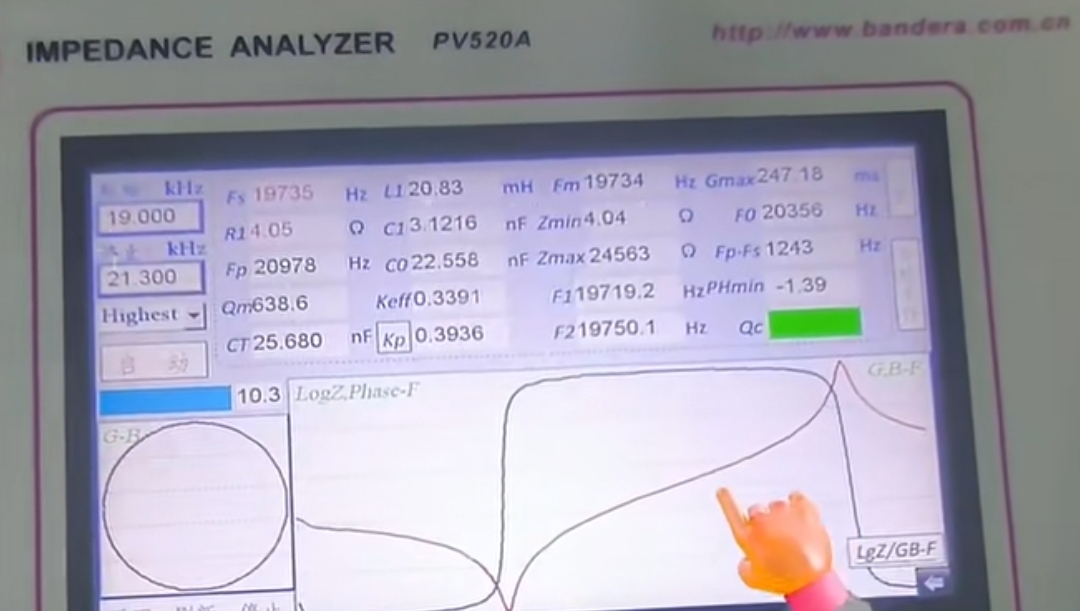
Impedance (Z) and admittance (Y) are reciprocal in mathematics, describing the same characteristic from both sides.
Impedance curve: displays the variation of impedance with frequency. The lowest point of the curve corresponds to the series resonant frequency (Fs), at which the impedance is the smallest and the efficiency is the highest. The highest point corresponds to the parallel resonance frequency (Fp), at which point the impedance is at its maximum.
• Admittance curve: displays the variation of admittance with frequency, with the common red and blue double lines in the figure:
Red (conductivity G): reflects the ability of energy conversion and loss. Its peak corresponds to the series resonant frequency (Fs).
Blue (Nano B): reflects the internal energy storage characteristics. The zero crossing point of the curve corresponds to the parallel resonance frequency (Fp).
In addition, drawing the conductance G and the admittance B on a complex plane will result in an admittance circle diagram, which can more intuitively evaluate the overall health status.
How to judge: Focus on several key indicators
The core of judgment is to check whether the curve is "healthy" and whether the key parameters meet the standards.
1. Observe the curve shape (qualitative judgment):
Health status: The admittance circle diagram should be a smooth, rounded circle or ellipse; The resonance peak of the impedance curve should be clear and sharp; The change pattern of admittance curve is clear.
Abnormal state: If the curve shows distortion, burrs, multiple peaks, or multiple parasitic small circles, it indicates that the transducer may have internal defects such as cracks or detachment.
2. Read key parameters (quantitative judgment):
Resonant frequency (Fs): must be highly consistent with the design value or "golden sample". Deviation may indicate abnormal size or internal structure.
Dynamic resistance (R1): the impedance at point Fs. The lower the better, low R1 represents low loss and high efficiency. Excessive R1 may indicate internal cracks and other issues.
Mechanical quality factor (Qm): reflects the sharpness of the resonance peak. The sharper the curve, the higher the Qm. Different applications require different requirements: high efficiency in cleaning/welding requires high Qm, while high resolution in imaging detection requires low Qm (wide bandwidth).
Static capacitance (C0): It should be within the normal range. Deviation may indicate a problem with the material or electrode.
Of course, these three sets of data are only a preliminary judgment of the quality of the ultrasonic transducer. There are also some core parameters that need to be selected based on your actual application, such as sensitivity, capacitance, bandwidth, etc. MIC Metering provides high-quality ranging and flow measurement ultrasonic transducers. For detailed parameters, please visit www.micmetering.com product page for detailed information.
- Previous:Choosing pole pairs for a resolver
- Next:Already the last article
Links:Service Hotline
+86 13923792185
Website:www.micmetering.com
Address:6th Floor, Block B, Area A, Qinghu Science and Technology Park, Longhua District, Shenzhen, Guangdong Province
Copyright © 2025 MIC Metering (Shenzhen) Limited 粤ICP备2025358196号-1 Cookies Policy-
Service Hotline
Service Hotline
+86 13923792185
-
WeChat

-
TOP
Our Cookie Usage Policy
Our website uses cookies and other similar technologies to distinguish you from other users of our website. This helps us provide you with a good experience when you browse our website and allows us to improve our website. For more information, please refer to our Cookie Policy. - About Us